
Analytics Dashboard
Real-Time Data Reporting
Analytics Dashboard
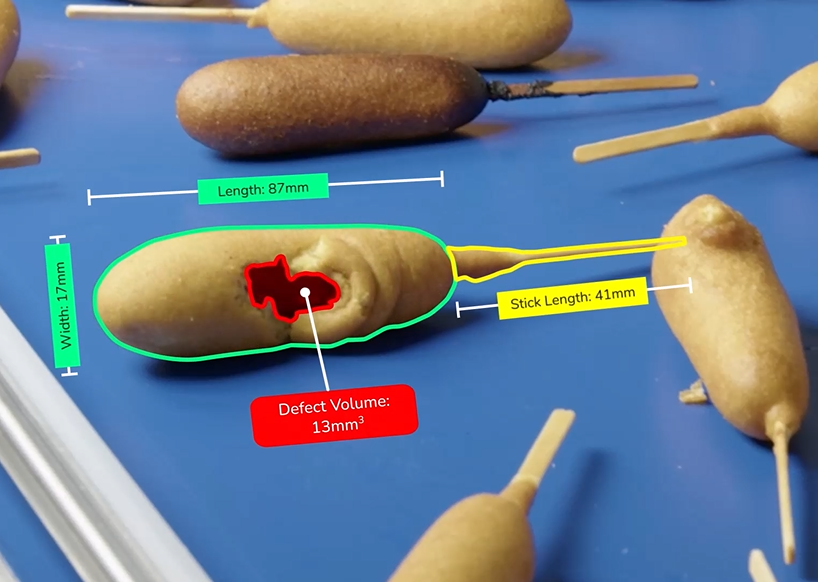
The V-CORTX Analytics Dashboard turns your inspection data into a strategic advantage. An image of every product is captured, visualized, and contextualized for easy reference.
Unlike other data products, our Analytics Dashboard isn’t just about charts and graphs. With comprehensive data attached to every product that passes through the system, the dashboard becomes a living digital record of your line, allowing you to identify deviations early, investigate root causes quickly, and drive focused process improvements.

Stay ahead of quality issues
Detect problems before they escalate
The dashboard provides real-time visibility into inspection trends, enabling you to identify subtle shifts in quality before they become major issues. You’ll know when something’s off before it leads to scrap, rework, customer complaints, or brand damage.

Digital records for every product
Every product inspected becomes a data point in a comprehensive, timestamped log complete with dimensional measurements, defect classifications, and inspection outcomes. This creates a searchable record of production that supports traceability, compliance, and continuous improvement.
Dive deep into defects
See beyond what failed and start to see why it failed. The V-CORTX Analytics Dashboard allows users to zoom in on failure patterns, segment by machine, shift, or product variation, and trace issues to specific steps in the process. This makes root-cause analysis fast and focused, so you can fix problems where they start, not just where they show up.
With Analytics Dashboard, you get real-time insights to act on immediately.
This webinar features:
- Real-world ROI use cases with our visual AI used in quality inspection
- A deep dive into our intuitive analytical dashboard for smart decision-making
- Insights on how our Visual AI solutions can streamline your operations.